Note
Go to the end to download the full example code
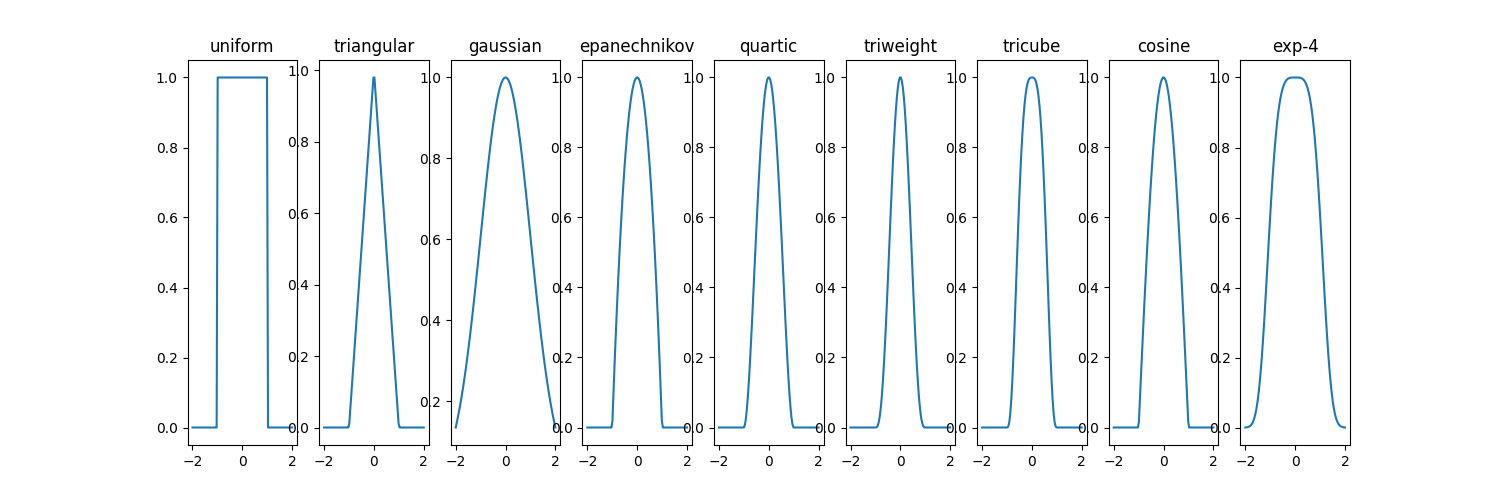
Plot kernel functions
This script requires matplotlib

import matplotlib.pyplot as plt
import numpy as np
from rlberry_research.agents.kernel_based.kernels import kernel_func

kernel_types = [
    "uniform",
    "triangular",
    "gaussian",
    "epanechnikov",
    "quartic",
    "triweight",
    "tricube",
    "cosine",
    "exp-4",
]

z = np.linspace(-2, 2, 100)


fig, axes = plt.subplots(1, len(kernel_types), figsize=(15, 5))
for ii, k_type in enumerate(kernel_types):
    kernel_vals = kernel_func(z, k_type)
    axes[ii].plot(z, kernel_vals)
    axes[ii].set_title(k_type)
plt.show()
Total running time of the script: (0 minutes 6.820 seconds)