Note
Go to the end to download the full example code
Record reward during training and then plot it
This script shows how to modify an agent to easily record reward or action during the fit of the agent and then use the plot utils.
Note
If you already ran this script once, the fitted agent has been saved in rlberry_data folder. Then, you can comment-out the line
agent.fit(budget=10)
and avoid fitting the agent one more time, the statistics from the last time you fitted the agent will automatically be loaded. See rlberry.manager.plot_writer_data documentation for more information.
[INFO] 13:51: ... trained!
[INFO] 13:51: Saved ExperimentManager(UCBVIAgent) using pickle.
[INFO] 13:51: The ExperimentManager was saved in : 'rlberry_data/temp/manager_data/UCBVIAgent_2025-03-07_13-51-50_43ae8643/manager_obj.pickle'
import numpy as np
from rlberry_scool.envs import GridWorld
from rlberry.manager import plot_writer_data, ExperimentManager
from rlberry_scool.agents import UCBVIAgent
import matplotlib.pyplot as plt
# We wrape the default writer of the agent in a WriterWrapper
# to record rewards.
class VIAgent(UCBVIAgent):
name = "UCBVIAgent"
def __init__(self, env, **kwargs):
UCBVIAgent.__init__(self, env, writer_extra="reward", horizon=50, **kwargs)
env_ctor = GridWorld
env_kwargs = dict(
nrows=3,
ncols=10,
reward_at={(1, 1): 0.1, (2, 9): 1.0},
walls=((1, 4), (2, 4), (1, 5)),
success_probability=0.7,
)
env = env_ctor(**env_kwargs)
xp_manager = ExperimentManager(VIAgent, (env_ctor, env_kwargs), fit_budget=10, n_fit=3)
xp_manager.fit(budget=10)
# comment the line above if you only want to load data from rlberry_data.
# We use the following preprocessing function to plot the cumulative reward.
def compute_reward(rewards):
return np.cumsum(rewards)
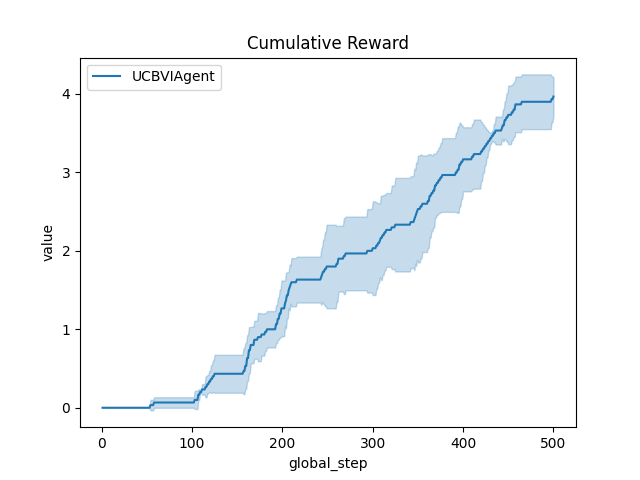
# Plot of the cumulative reward.
output = plot_writer_data(
xp_manager, tag="reward", preprocess_func=compute_reward, title="Cumulative Reward"
)
# The output is for 500 global steps because it uses 10 fit_budget * horizon
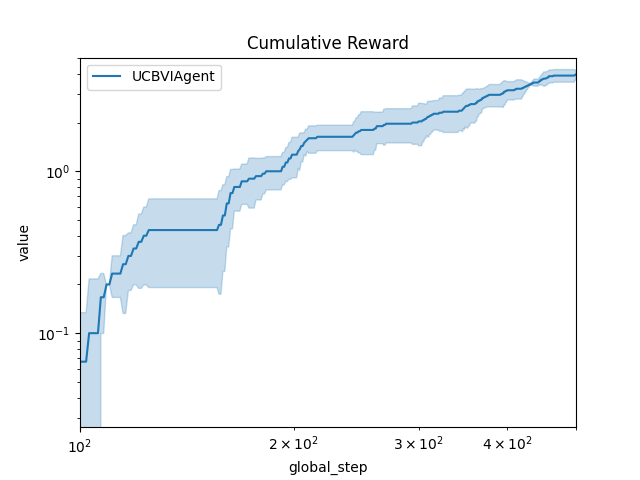
# Log-Log plot :
fig, ax = plt.subplots(1, 1)
plot_writer_data(
xp_manager,
tag="reward",
preprocess_func=compute_reward,
title="Cumulative Reward",
ax=ax,
show=False, # necessary to customize axes
)
ax.set_xlim(100, 500)
ax.relim()
ax.set_xscale("log")
ax.set_yscale("log")
Total running time of the script: (0 minutes 3.161 seconds)