Note
Go to the end to download the full example code
Illustration of plotting tools on Bandits
This script shows how to define a bandit environment and an UCB Index-based algorithm.
import numpy as np
from rlberry_research.envs.bandits import NormalBandit
from rlberry_research.agents.bandits import (
    IndexAgent,
    makeSubgaussianUCBIndex,
    makeSubgaussianMOSSIndex,
)
from rlberry.manager import ExperimentManager, plot_writer_data
import matplotlib.pyplot as plt


# Parameters of the problem
means = np.array([0, 0.9, 1])  # means of the arms
T = 3000  # Horizon
M = 20  # number of MC simu


# Agents definition
class UCBAgent(IndexAgent):
    """UCB agent for sigma-subgaussian bandits"""

    name = "UCB Agent"

    def __init__(self, env, sigma=1, **kwargs):
        index, _ = makeSubgaussianUCBIndex(sigma)
        IndexAgent.__init__(self, env, index, writer_extra="action", **kwargs)


class MOSSAgent(IndexAgent):
    """Moss agent for sigma-subgaussian bandits"""

    name = "Moss Agent"

    def __init__(self, env, sigma=1, **kwargs):
        index, _ = makeSubgaussianMOSSIndex(T, len(means), sigma=sigma)
        IndexAgent.__init__(self, env, index, writer_extra="action", **kwargs)


# Construction of the experiment

env_ctor = NormalBandit
env_kwargs = {"means": means, "stds": 2 * np.ones(len(means))}

agent1 = ExperimentManager(
    UCBAgent,
    (env_ctor, env_kwargs),
    fit_budget=T,
    init_kwargs={"sigma": 2},
    n_fit=M,
    parallelization="process",
    mp_context="fork",
)

agent2 = ExperimentManager(
    MOSSAgent,
    (env_ctor, env_kwargs),
    fit_budget=T,
    init_kwargs={"sigma": 2},
    n_fit=M,
    parallelization="process",
    mp_context="fork",
)
# these parameters should give parallel computing even in notebooks


# Agent training

agent1.fit()
agent2.fit()


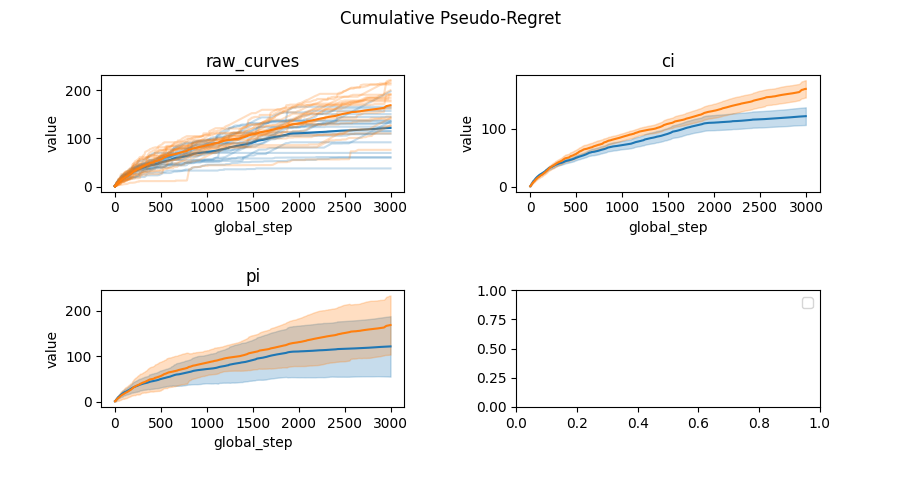
# Compute and plot (pseudo-)regret
def compute_pseudo_regret(actions):
    return np.cumsum(np.max(means) - means[actions.astype(int)])


fig, axes = plt.subplots(2, 2, figsize=(9, 5))
axes = axes.ravel()
fig.tight_layout(pad=5.0)  # give some space for titles

plt.suptitle("Cumulative Pseudo-Regret")

for i, error in enumerate(["raw_curves", "ci", "pi"]):
    output = plot_writer_data(
        [agent1, agent2],
        tag="action",
        preprocess_func=compute_pseudo_regret,
        title=error,
        smooth=False,
        error_representation=error,
        ax=axes[i],
        show=False,
    )


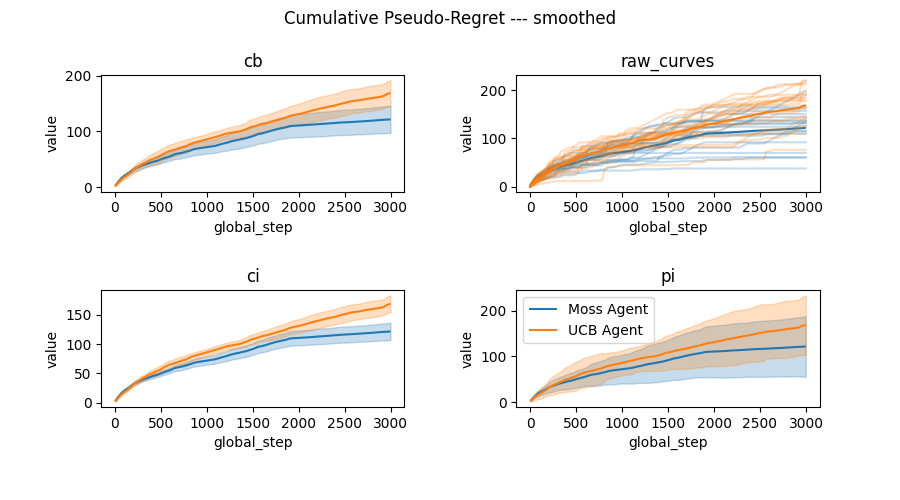
fig, axes = plt.subplots(2, 2, figsize=(9, 5))
axes = axes.ravel()
fig.tight_layout(pad=5.0)  # give some space for titles

plt.suptitle("Cumulative Pseudo-Regret --- smoothed")

for i, error in enumerate(["cb", "raw_curves", "ci", "pi"]):
    output = plot_writer_data(
        [agent1, agent2],
        tag="action",
        preprocess_func=compute_pseudo_regret,
        title=error,
        smooth=True,
        error_representation=error,
        ax=axes[i],
        show=False,
    )


plt.show()
Total running time of the script: (0 minutes 16.090 seconds)

